Air: the silent health emergency with the greatest avoidable mortality
Air pollution is the largest environmental cause of disease and premature death in the world. The WHO estimated in 2022 that exposure to fine particulate matter (PM2.5) causes 4.2 million premature deaths per year, of which 2.5 million occur in urban areas of low- and middle-income countries. In the EU, air pollution causes 238,000 premature deaths/year from PM2.5, 49,000 from NO2, and 24,000 from tropospheric O3 (EEA, Air Quality in Europe 2023). European cities exceed WHO limits (5 microg/m3 annual PM2.5) in 97% of cases: Madrid registers 10 microg/m3, Milan 21 microg/m3, Warsaw 20 microg/m3, and Krakow 25 microg/m3. The health cost of air pollution in the EU amounts to 330,000-940,000 billion EUR/year, including medical treatments, workplace absenteeism, lost productivity, and years of life lost (EC, Clean Air Outlook, 2021). In Spain, health costs are estimated at 50 billion EUR/year, equivalent to 3.7% of GDP (Lancet Commission on Pollution and Health, 2022 update).
Interventions to improve urban air quality exhibit exceptionally favorable cost-benefit ratios. The introduction of low-emission zones (LEZ) in Europe has demonstrated reductions of 15-25% in NO2 concentrations and 8-15% in PM2.5 in the affected areas, with implementation costs of 5-15 million EUR per medium-sized city and health benefits of 200-800 million EUR/year (EC, Impact Assessment LEZ, 2022). Electrification of residential heating (replacing coal and oil boilers with heat pumps) reduces PM2.5 emissions by 90-99% at the emission point. Krakow (Poland) banned domestic coal burning in 2019 and recorded a 37% reduction in winter PM10 within 3 years, at a public cost of 180 million EUR in boiler replacement subsidies and an estimated health benefit of 700 million EUR/year (ratio 1:3.9). The argument for prioritizing air is the magnitude of avoidable harm: every 1 microg/m3 reduction in PM2.5 reduces cardiovascular mortality by 1% and extends average life expectancy by 0.05-0.1 years (Pope et al., 2009).
Water: critical infrastructure with a growing investment gap
Water stress affects 2.4 billion people living in water-scarce countries, and 733 million reside in areas of high or critical water stress (UN Water, 2023). Cities consume 12% of global freshwater, but 35% of treated water is lost to leaks in aging networks: Madrid loses 8%, London 24%, Mexico City 40%, and Jakarta 50%. Renewing urban distribution networks globally would require an investment of 1.7 trillion USD over the next 20 years (OECD, 2022), but current investment is only 45% of what is needed. In the EU, the revised Drinking Water Directive (2020/2184) requires the assessment and reduction of leaks to a maximum of 20% in cities with more than 100,000 inhabitants by 2030. Water scarcity has an economic cost of 260 billion USD/year in lost global GDP, concentrated in the Middle East, North Africa, India, and China (World Bank, 2016). In Spain, Guadalquivir basin reservoirs stood at 24% capacity in September 2023, with irrigation restrictions that reduced Andalusian agricultural production by 22% (CHG, 2023).
Efficient water management in buildings reduces urban demand by 30% to 60% through three strategies: low-flow fixtures (faucets at 5 L/min versus 12 L/min conventional, dual-flush toilets at 3/6 L versus 9 L), greywater reuse for irrigation and cisterns (saving 25-35%), and rainwater harvesting (contributing 30-80 m3/year per 100 m2 of roof area in a Mediterranean climate). The cost of these measures is 15-45 EUR/m2 of built area, with payback periods of 5-10 years at current water prices (2-4 EUR/m3 in Spain). However, water has a distinctive feature: it is a resource with no substitute. While energy can be generated from multiple sources and air pollution has gradual intervention thresholds, absolute water scarcity (< 500 m3/inhabitant per year) triggers irreversible humanitarian crises. This condition as an irreplaceable resource underpins the argument for prioritizing water management in cities where stress is already high or critical, affecting 4 billion people at least one month per year (Mekonnen and Hoekstra, 2016).
Pollution and waste: the accumulated burden that mortgages the future
Urban soil contamination affects 2.8 million potentially contaminated sites in the EU, of which only 650,000 have been investigated and 100,000 remediated (EEA, 2022). Remediation costs range from 50 EUR/m3 for in-situ biological techniques to 300-800 EUR/m3 for excavation and ex-situ treatment, generating bills of 2-50 million EUR per contaminated industrial site. The accumulated environmental liability of contaminated soils in the EU is estimated at 119 billion EUR (JRC, 2018). Noise pollution, frequently underestimated, affects 113 million Europeans exposed to traffic noise levels above 55 dB Lden, with health costs of 12 billion EUR/year from cardiovascular disease, sleep disorders, and childhood cognitive impairment (EEA, Environmental Noise in Europe, 2020). A 10 dB increase in nighttime noise exposure raises the risk of heart attack by 14% (Munzel et al., 2014). Buildings with facade sound insulation conforming to EN ISO 717-1 (D2m,nT,w of at least 35 dB in residential zones) reduce indoor exposure by 60-80%, at an additional cost of 3-5% on the building envelope.
Municipal solid waste represents a growing pressure. Cities worldwide generate 2.1 billion tonnes/year of MSW, a figure that will rise to 3.4 billion by 2050 (World Bank, 2018). The EU generates 225 million tonnes/year of MSW (502 kg/inhabitant), with recycling rates of 49% (Eurostat, 2023), far from the 65% target for 2035 under Directive 2018/851. Inadequate waste management generates methane emissions of 800 million tCO2e/year globally (18% of anthropogenic methane emissions), groundwater contamination from leachate, and microplastics found in 83% of tap water analyzed in global studies (Kosuth et al., 2018). The circular economy in construction, including component reuse and high-quality CDW recycling, can reduce materials-sector emissions by 40-60% and waste to landfill by 80-95%, but requires upfront investments in sorting infrastructure, processing plants, and secondary markets that few municipalities in the Global South can finance.
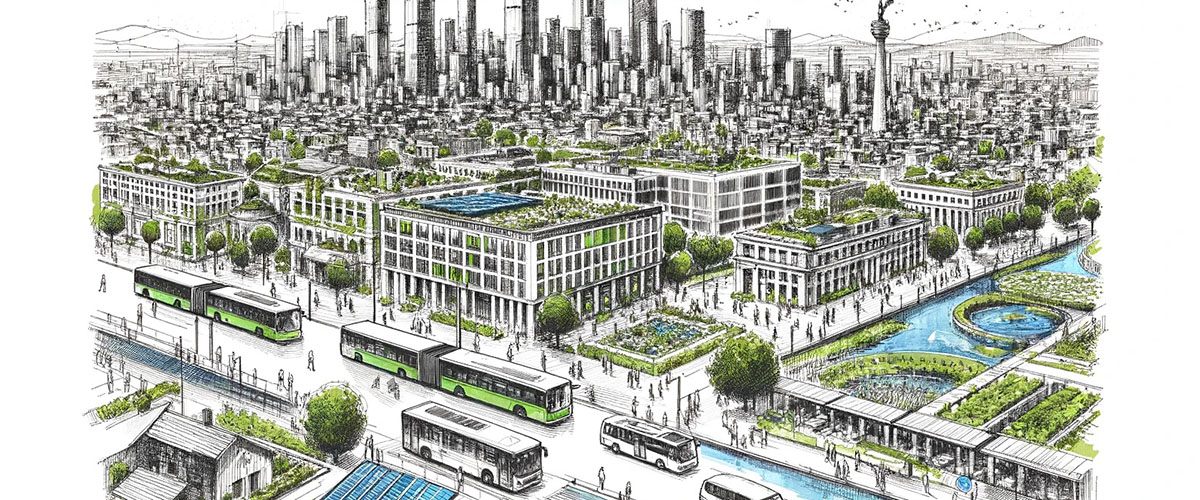
Transport, synergies, and the case for an integrated approach
Urban transport generates between 20% and 35% of city CO2 emissions, with extreme variations: Los Angeles devotes 40% of its surface area to road infrastructure and transport generates 47% of its emissions, while Tokyo, with 86% of trips made by public transit, limits transport's share of emissions to 16% (UITP, 2023). Investment in mass public transport yields returns of 1:4 to 1:7: every euro invested in metro or BRT avoids between 4 and 7 EUR in congestion, pollution, accident, and land-use costs (ITDP, 2023). Transport electrification is advancing rapidly: electric buses represent 18% of global bus sales in 2023 (mainly in China, with 770,000 units in service), and electric passenger vehicles reached 18% of global new car sales (14 million units). Limited-traffic zones reduce NOx emissions by 20-35% and noise by 3-5 dB in the affected area, with co-benefits in road safety (30-50% reduction in serious accidents) and local commercial activity (5-15% increase in turnover).
The answer to what should be prioritized is not universal but context-dependent, yet the evidence favors an integrated approach that exploits synergies between interventions. Electrifying transport and heating simultaneously improves air quality, reduces CO2 emissions, and decreases noise. Green roofs retain stormwater, reduce the heat island effect, improve local air quality, and lower cooling demand. Planned urban densification reduces motorized transport demand, optimizes water and sanitation networks, and facilitates district heating/cooling systems. A meta-analysis of 132 urban interventions conducted by the New Climate Economy (2018) concluded that the measures with the greatest co-benefits are: high-capacity public transport (cost-benefit ratio 1:5.2), building energy retrofitting (1:3.8), green infrastructure (1:3.5), and efficient water cycle management (1:3.1). Optimal prioritization depends on each city's starting point: a city with 99 microg/m3 of PM2.5 (Delhi) must prioritize air; one with 50% network leaks (Jakarta) must prioritize water; but in cities with moderate levels across all indicators (most European ones), the greatest efficiency comes from integrated packages that act on all four fronts simultaneously, capturing synergies that isolated sectoral interventions cannot generate.
References
- [1]Air Quality in Europe 2023EEA. ISBN: 978-92-9480-588-3
- [2]Fine-Particulate Air Pollution and Life Expectancy in the United StatesNew England Journal of Medicine, 360(4), 376-386.
- [3]Four Billion People Facing Severe Water ScarcityScience Advances, 2(2), e1500323.
- [4]Unlocking the Inclusive Growth Story of the 21st CenturyGlobal Commission on the Economy and Climate.
- [5]Cardiovascular Effects of Environmental Noise ExposureEuropean Heart Journal, 35(13), 829-836.


Comments 0
No comments yet. Be the first!
Leave a comment