Definition and reference frameworks for sustainable communities
A sustainable community is a human settlement planned and managed to meet the current needs of its inhabitants without compromising the ability of future generations, integrating the environmental, social, and economic dimensions in a balanced way. The Egan Review (2004), commissioned by the British government, defined 8 components of a sustainable community: governance, transport and connectivity, services, environment, economy, housing and built environment, society and culture, and equity. The European Reference Framework for Sustainable Cities (RFSC) establishes 30 quantified indicators grouped into 5 dimensions. At an operational level, a sustainable community is distinguished from a conventional neighborhood by verifiable metrics: CO₂ emissions per capita ≤ 3.0 tCO₂/year (compared to 6-10 tCO₂/year in conventional European urban areas), residential energy consumption ≤ 50 kWh/m²·year, green area ≥ 15 m²/inhabitant (WHO recommendation: 9 m² minimum), and percentage of trips by public transport, bicycle, or on foot ≥ 60% (European Commission, 2020).
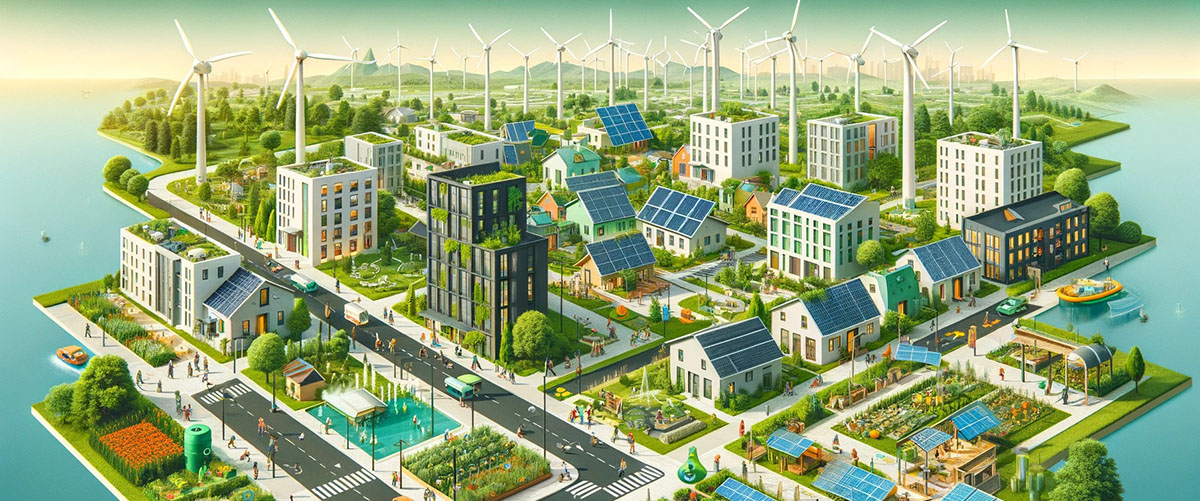
Eco-neighborhoods (écoquartiers in France, Ökosiedlungen in Germany) constitute the most consolidated materialization of the sustainable community concept. Europe has more than 200 eco-neighborhoods developed since the 1990s, with a notable concentration in Germany (80+), France (50+, driven by the national ÉcoQuartier program since 2009 with 500+ applications), the Netherlands, and Scandinavia. These projects share quantifiable characteristics: medium-high density (50-150 dwellings/hectare), mixed uses (residential, commercial, facilities in a 60:25:15 ratio), sustainable mobility (parking limited to 0.3-0.5 spaces/dwelling), on-site renewable energy (covering 30-80% of demand), and integrated stormwater management with sustainable drainage systems (SuDS) that retain 80-95% of runoff at source. The sustainable community is not a theoretical utopia but an urban planning model with 30 years of accumulated empirical evidence.
Vauban, BedZED, and Hammarby: three quantified models
The Vauban neighborhood (Freiburg, Germany, 38 hectares, 5,500 inhabitants, developed between 1998 and 2006 on a former French military barracks) is the world's benchmark eco-neighborhood. Its verified metrics include: 100% of buildings meet the low-energy standard (≤ 65 kWh/m²·year), 30% achieve the Passivhaus standard (≤ 15 kWh/m²·year), and 100+ dwellings are Plusenergie (they produce more energy than they consume). Biomass cogeneration and solar photovoltaics cover 65% of energy demand. 70% of households do not own a car (compared to 15% of the Freiburg average), facilitated by a tram line with a maximum distance of 500 m to a stop and a cycling network of 5 km/km². Per capita CO₂ emissions are 2.2 tCO₂/year, 74% lower than the German average of 8.5 tCO₂/year (Stadt Freiburg, 2018).
BedZED (Beddington Zero Energy Development, Sutton, London, 1.7 hectares, 100 dwellings + 2,500 m² of offices, 2002, designed by Bill Dunster Architects) was the UK's first net zero emissions development. Buildings consume 81% less energy for heating than the British average, 45% less electricity, and 58% less water (BioRegional, 2014). South orientation, thermal mass from 300 mm of concrete with 300 mm of mineral wool insulation, and ventilation chimneys with heat recovery (efficiency 70%) eliminate the need for conventional heating. Hammarby Sjöstad (Stockholm, 200 hectares, 26,000 projected inhabitants, developed 1999-2018) applies the integrated urban metabolism model: organic waste generates biogas for kitchens and buses; treated wastewater produces heat and electricity through anaerobic digestion and heat pumps; 80% of solid waste is recycled or energy-recovered. Water consumption is 100 liters/person·day compared to the Swedish average of 200 liters, and per capita CO₂ emissions are 50% below Stockholm's municipal target.
Planning and design of a sustainable community
Planning a sustainable community requires an integrated process that begins with site analysis: topography, local climate (radiation, prevailing winds, temperature), hydrology (water table levels, runoff), ecology (habitats, ecological corridors, protected species), existing infrastructure (public transport, utility networks), and socioeconomic context (demographics, economic activity, facilities). Urban design optimizes urban form according to bioclimatic criteria: main road network oriented north-south or with a maximum deviation of 15-20° to ensure solar access to south facades; street width dimensioned with a solar obstruction angle ≤ 45° at the winter solstice (H/W ratio ≤ 1:1 at latitudes 37-43°N); plots with main facade oriented within the range south ± 30°; and public spaces protected from prevailing winter wind by the building fabric itself. The optimal density for public transport viability is 60-120 dwellings/hectare (Newman and Kenworthy, 2015), equivalent to 3-6 story buildings with 40-60% plot coverage.
The infrastructure of a sustainable community integrates 5 interconnected systems. Energy: district heating/cooling network fed by renewable sources (biomass, geothermal, solar thermal) with seasonal storage; distributed photovoltaic generation on rooftops (potential of 60-100 kWp/hectare of urbanized area). Water: separation of grey and black water; reuse of treated grey water for irrigation and toilet flushing (saving 30-40% of consumption); SuDS systems (green swales, infiltration wells, green roofs) that reduce peak runoff by 60-80%. Waste: pneumatic collection or door-to-door sorting with recycling targets ≥ 65% and landfill ≤ 10%. Mobility: hierarchy of pedestrian > bicycle > public transport > shared vehicle > private vehicle, with peripheral parking and streets limited to 20 km/h. Urban green: connected green space network with a minimum of 15-20 m²/inhabitant and maximum distance of 300 m from any dwelling to a green space of ≥ 5,000 m² (European Environment Agency accessibility standard). A sustainable community is, in essence, an urban metabolic system designed to close material and energy loops at the neighborhood scale.
Monitoring indicators and lessons learned
Evaluating a sustainable community requires measurable indicators over time. The European RFSC proposes 30 key indicators, among which the most notable are: GHG emissions per capita (target: < 3.0 tCO₂eq/year), energy consumption per capita (target: < 20 MWh/year), renewable energy percentage (target: > 40%), water consumption per capita (target: < 100 L/day), recycling rate (target: > 60%), green space per capita (target: > 15 m²), sustainable modal split (target: > 60% non-motorized + public transport), and residential satisfaction (target: > 80% of surveyed residents satisfied). The CASBEE for Urban Development (Japan) and LEED for Neighborhood Development (USA) systems provide comparable certification frameworks at the neighborhood scale, with more than 400 projects certified LEED-ND globally (USGBC, 2023).
Lessons learned from 30 years of European eco-neighborhoods reveal critical success and failure factors. Success factors include: citizen participation from the planning phase (70-85% of successful eco-neighborhoods incorporate formal participatory processes), community management of shared infrastructure (energy cooperatives, community gardens, shared workshops), and post-occupancy monitoring with feedback to residents. The most frequent failure factors are: the performance gap (buildings consume 30-100% more energy than simulated during the design phase, Menezes et al., 2012), gentrification (eco-neighborhoods can raise housing prices by 15-30% and displace original populations), and insufficient public transport connections (peripheral eco-neighborhoods that generate car dependency). The ideal sustainable community is dense, mixed-use, connected, participatory, and monitored — and acknowledges that sustainability is not a final state but a continuous improvement process measured by quantifiable indicators.


Comments 0
No comments yet. Be the first!
Leave a comment