Scale of the problem: construction as the planet's largest consumer of resources
The environmental impact of Construction, what you need to know begins with the sheer scale of the sector: the construction industry consumes 40-50% of all raw materials extracted globally — 50 billion tonnes per year of sand, gravel, stone, clay, timber, metals, and minerals (UNEP, 2019). The manufacture of construction materials generates 11% of global CO2 emissions (4,000 MtCO2 per year), distributed as follows: cement (2,700 MtCO2, representing 8% of the global total — more than aviation and maritime shipping combined), steel used in construction (600 MtCO2, accounting for 25% of total steel industry emissions), aluminium (200 MtCO2), glass (100 MtCO2), and other materials (400 MtCO2). The sector additionally generates 35% of solid waste in the EU (374 million tonnes per year of construction and demolition waste — CDW, Eurostat 2022).
Current trajectories exacerbate the problem: global demand for construction materials will grow by 40-60% by 2060 (IEA/UNEP Global Status Report, 2022), driven by urbanisation in Asia and Africa (2.5 billion new urban residents by 2050). Without intervention, construction material emissions will reach 5,500-6,000 MtCO2 per year by 2050 — incompatible with the 1.5 degrees C target of the Paris Agreement. Decarbonising materials requires action on two fronts: (1) reducing the quantity of material per m2 of built area (efficient design, topological optimisation, reuse of existing structures) and (2) reducing the emissions per kg of material produced (fuel switching, carbon capture, circular economy). Understanding this dual challenge is the essential first step in grasping the environmental impact of construction materials and what can be done to mitigate it.
Raw material extraction: sand, aggregates and mining
Sand and gravel are the most extracted natural resources on the planet after water: 40-50 billion tonnes per year (UNEP, 2019 — although figures vary due to the difficulty of comprehensive accounting). Extraction affects: rivers (bed erosion, bank collapse, disruption of aquatic habitats — the Mekong River has lost 50% of its sediment load over 20 years due to intensive extraction), coastlines (beach erosion — Indonesia has lost 24 islands in part due to coastal sand extraction), and quarries (destruction of terrestrial ecosystems, noise, dust, visual impact). The most sustainable alternative is recycled aggregate derived from CDW: demolished concrete is crushed to a grading of 4-20 mm and can replace 20-30% of natural aggregate in new concrete without significant loss of strength (compressive strength reduction below 5%).
Metal mining for construction (iron, aluminium, copper, zinc) generates: overburden movement (waste-to-ore ratio: 3-10:1 for iron, 100-500:1 for copper), water contamination (acid mine drainage: pH 2-4, containing heavy metals), deforestation (mining accounts for 7% of tropical deforestation — Global Forest Watch), and energy consumption (primary aluminium production requires 14-16 MWh/tonne — the most energy-intensive structural metal). Mitigation strategies include: maximising recycled content (EAF steel: above 80% recycled scrap; recycled aluminium requires 95% less energy than primary production), using materials with lower processing intensity (timber, rammed earth, stone: production energy 10-100 times lower than metals), and applying responsible sourcing criteria (BES 6001, Responsible Minerals Initiative). The sand extraction impact alone — affecting river systems, coastal communities, and marine biodiversity worldwide — illustrates that the environmental consequences of construction materials begin long before those materials arrive at the building site.
Manufacturing: cement, steel and industrial carbon intensity
The manufacture of Portland cement generates emissions through two pathways: limestone calcination (CaCO3 decomposes to CaO + CO2: 0.53 kgCO2/kg of clinker — a process emission irreducible with current chemistry) and fuel combustion to reach 1,450 degrees C in the rotary kiln (0.30-0.40 kgCO2/kg of clinker). Total: 0.80-0.95 kgCO2/kg of CEM I Portland cement. Global cement production stands at 4,200 million tonnes per year (2023, Statista), with China accounting for 55%. Decarbonisation pathways include: clinker substitution with supplementary cementitious materials (GGBS, fly ash, natural pozzolans, limestone: emissions reduction of 20-60%), alternative fuels (biomass, waste: thermal emissions reduction of 15-30%), energy efficiency (waste heat recovery: minus 5-10%), and carbon capture, utilisation and storage (CCUS) — the Heidelberg Materials pilot project at Brevik, Norway captures 50% of plant emissions, operational from 2024. These cement CO2 emissions strategies collectively chart a pathway toward reducing the sector's contribution from the current 8% of global emissions.
Steel manufacturing emits an average of 1.85 tCO2/tonne globally (World Steel Association, 2023): 71% of global steel is produced via the BOF route (blast furnace plus converter: 2.0-2.5 tCO2/t) and 29% via the EAF route (electric arc furnace with scrap: 0.3-0.8 tCO2/t depending on the electricity mix). Steel decarbonisation pathways include: electrification with renewables (EAF powered by 100% renewable electricity: below 0.2 tCO2/t), direct reduction with green hydrogen (H-DRI: the HYBRIT project by SSAB achieves below 0.1 tCO2/t, targeted for 2030), and maximising recycling rates (steel is infinitely recyclable without quality degradation — the current global recycling rate is 85%, but could reach 95% with improved separation infrastructure). These decarbonisation technologies will initially increase steel costs by 20-40%, but they are indispensable for achieving net-zero emissions in the sector by 2050. Together, the cement and steel industries account for the overwhelming majority of construction material emissions, making their transformation the single most important lever for reducing the environmental impact of the built environment.
Transport, use phase and end of life: the complete lifecycle
The transport of materials (module A4 per EN 15978) typically represents 2-5% of total embodied carbon, but is highly variable depending on distance and transport mode: road haulage (0.06-0.15 kgCO2/t per km), rail (0.02-0.04 kgCO2/t per km), maritime shipping (0.01-0.02 kgCO2/t per km). A heavy material such as concrete (density: 2,400 kg/m3) transported 200 km by road emits 30-70 kgCO2/m3 in module A4 — equivalent to 10-20% of its manufacturing emissions (A1-A3). The strategy is to prioritise local materials (sourced within 500 km) and lightweight materials for long-distance transport.
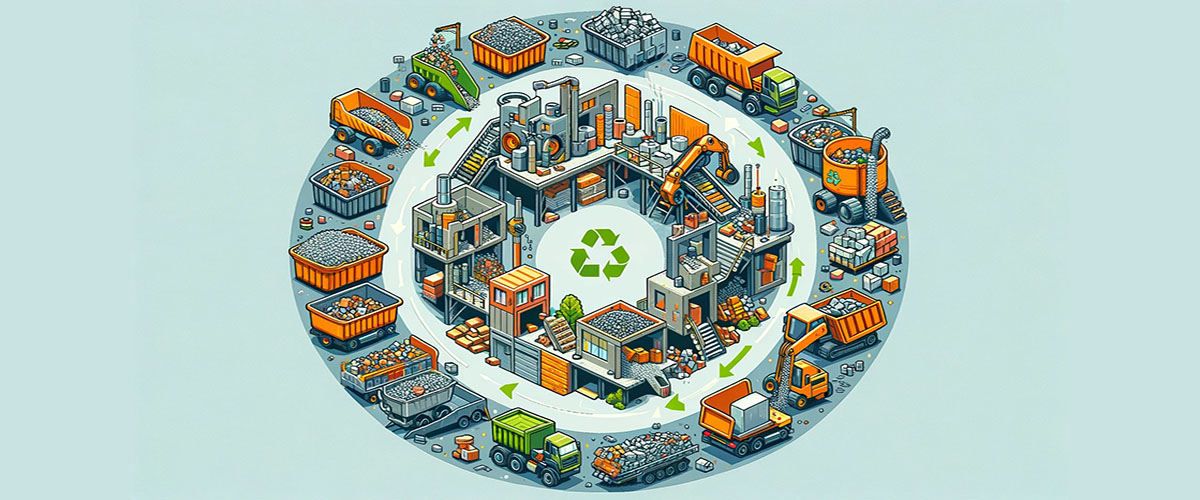
During the use phase (modules B1-B7), materials influence building energy consumption through their thermal mass (concrete: 2,060 kJ/m3K; timber: 770 kJ/m3K; steel: 3,800 kJ/m3K but with minimal element thickness), their thermal conductivity (which determines the required insulation thickness), and their durability (which governs replacement frequency under modules B3-B4). At end of life (modules C1-C4), construction generates 374 million tonnes per year of CDW in the EU (2020), of which 69% is recycled (Eurostat) — though the majority constitutes downcycling (crushed concrete used as fill). The EU Waste Framework Directive (2008/98/EC) set a target of 70% recovery of CDW by 2020 (achieved at the EU level but not in every member state). Module D quantifies the benefits of reuse and recycling beyond the system boundary: a building with bolted steel structure, modular facade, and material passports can achieve a module D credit of -50 to -150 kgCO2eq/m2, offsetting a substantial portion of its initial emissions. Understanding each lifecycle phase — from extraction through manufacturing, transport, use, and end of life — provides the complete picture of the environmental impact of construction materials, and reveals that meaningful mitigation requires coordinated action across every stage rather than isolated improvements at any single point.
References
- [1]Sand and Sustainability: 10 Strategic Insights to Avert a CrisisUnited Nations Environment Programme / GRID-Geneva. ISBN: 978-92-807-3751-6
- [2]Global Status Report for Buildings and Construction 2022International Energy Agency / United Nations Environment Programme.
- [3]Steel Statistical Yearbook 2023 — Sustainability IndicatorsWorld Steel Association.
- [4]Generation of waste by waste category, hazardousness and NACE Rev. 2 activity — Construction waste statisticsEuropean Commission / Eurostat.
- [5]Brevik CCS Project: First Full-Scale Carbon Capture at a Cement PlantHeidelberg Materials / Northern Lights JV.

Comments 0
No comments yet. Be the first!
Leave a comment